The US stock markets closed the week on the mixed territory after a powerful opening of 2012 in which the main indices rose more than 8%. The main reason for this amazing rally is the fact that more than 65% of the largest 500 companies reported better than expected reports regarding the 4
th quarter of 2011. NASDAQ has already broken the height of 2011 and the Dow Jones and the S&P 500 are approaching those picks.
The result season is not over yet and therefore the stocks might keep rising, but it is clear in this point, that a correction will occur soon, and if the indices slide under last week's low, it will be a significant signal for a possible correction.
On the fundamental aspect, the US economy grew 2.8% annual pace in the fourth quarter, which was less than expectations, but showed that the largest economy is on the right track for recovery. In Europe, Greece is still on the center and the agreements with the private sector regarding the haircut are getting close, but Germany put up an obstacle to Greece as it insists to have the ability to interfere in the Greek budget, in case the EU leaders will have to.
EUR/USD
The risings of the stocks brought back the positive correlation between the EUR and the stock markets, after few weeks that the EUR shed points in spite the bullish rally in Wall Street. The pair made an aggressive "short-squeeze" after it broke through the downtrend channel. The EUR overcame the resistance at 1.31 last week and the next target is the former break-down area at 1.335, though the EUR is overbought and might correct down any day.
The Forex market will wait for the NFP & unemployment rate on Friday, which will a significant influence on the USD.
USD/CHF
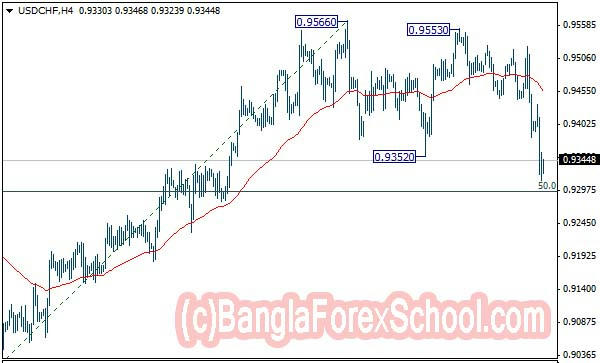
The CHF, which has been weakening against the USD since August 2011, is trying to show signs that the bullish trend has stopped. The pair made double/triple-top around 0.955-0.96 and started falling when the USD started losing power against the major currencies. It is interesting to see how this pair acts accurately according to the supports & resistances in the daily chart. The first strong support was at 0.93, which was a break-out area few months ago. The pair broke this important support and many sellers entered the market and pulled the price down to the next strong support at 0.91.
At this point, like other currencies, which made a strengthening movement against the USD, the CHF is overbought and therefore the USD might correct up from the current support. Likewise, the investors should always have in mind the possibility that the SNB will interfere the trading, but if the SNB does not interfere, the pair might continue sliding to the 200 SMA at 0.88.
USD/JPY
The USD made an impressive break-out at 77.30 last Tuesday, which was surprising because it was against the general weakness of the USD against the major currencies. However, the investors chose to take advantage of the situation and heavy sellers took the price back to the support of 76.5. A break-down of this support might slide to the low at 75.5, but the danger of an intervention exists here as well.
Risk Disclosure
Trading and the execution of transactions in currencies, commodities,CFD indexes and other financial products with or without using high financial leverage, is speculative trading of high risk and may cause substantial gain or loss proportional to the size of the collateral, up to the total loss of the collateral sum in a very short period. The fluctuation of the prices and rates in the currency markets, commodities, CFD ,indexes and other financial derivatives are often volatile and there is no accurate forecasting as per the size of the change, its direction and the time frame in which it occurs.You must consider carefully and seriously if this type of financial activity fits your needs, your financial resources and personal circumstances. Since the risk of losing some of the invested funds or all the funds in a relative short period is high; it is recommended that you use for that purpose funds which you designated for speculative financial transactions of high risk.
You acknowledge and fully understand that there may be more and other risks which are not detailed or not cotained above


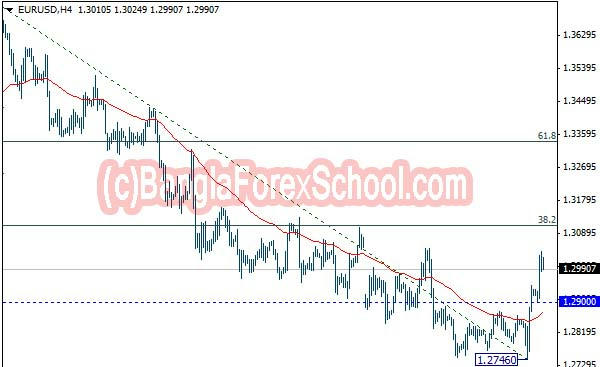
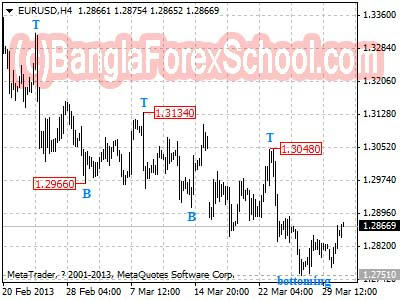 4H চার্ট একটু ভালো করে দেখুন পেয়ারটি 1.2751 প্রাইসে মনে হচ্ছে Cycle Bottom তৈরি করেছে বলে মনে হচ্ছে। পরবর্তীতে এই ঊর্ধ্বমুখী যাত্রা হয়তো অব্যাহত থাকতে পারে এবং প্রথম টার্গেট হতে পারে 1.2960 এরিয়া। Key Resistance রয়েছে 1.3000 প্রাইসে। Resistance এর ব্রেক 1.3710 ( Feb 1 High) থেকে শুরু হওয়া ডাউন ট্রেন্ডের কমপ্লিটের সিগন্যাল দিবে। Overall EUR/USD মুভমেন্ট বুলিশ থাকবে বলে আশা করছি।
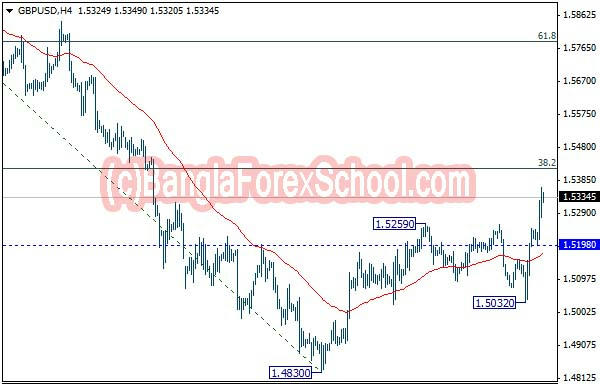
 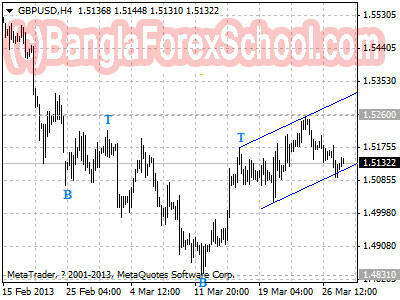 GBP/USD 4H চার্টে এখন প্রাইস চ্যানেলে সাপোর্টের মুখোমুখি। সেখান থেকে প্রাইস Rebound করে উপরে উঠতে পারে। আরেকটা বিষয় খেয়াল রাখতে হবে Upside এ প্রাইস যদি 1.5185 এর ক্লিয়ার ব্রেক করে তাহলে পরবর্তী টার্গেট হতে পারে 1.5350 zone। অপর দিকে সাপোর্ট এর ডাউন সাইড এ ক্লিয়ার ব্রেক প্রাইসকে আবার 1.4831 কে টেস্ট করাতে পারে। সবমিলিয়ে আজকে GBP/USD বলা যায় একটা কঠিন সময় এর মধ্যে দিয়ে যাচ্ছে তাই বাই সেল অর্ডার ওপেন এর পূর্বে ট্রেডারদেরকে প্রাইস মুভমেন্ট ভালো করে খেয়াল করার অনুরোধ জানাচ্ছি।
  USD/JPY 4H চার্টে এখনো Downtrend প্রাইস চ্যানেল এ রয়েছে, এবং 96.70 থেকে এই Downtrend শুরু হয়েছ। যতদিন প্রাইস চ্যানেল এর Upper line এ Resistance বহাল থাকবে আশা করছি ততদিন ডাউন ট্রেন্ড Continue করবে বলে আশা করছি। এবং পরবর্তী টার্গেট হতে পারে 92.00 -93.00 প্রাইস এরিয়া। অপরদিকে Upside Resistance এর ক্লিয়ার ব্রেক প্রাইসের নতুন ট্রেন্ড শুরু করতে পারে ।
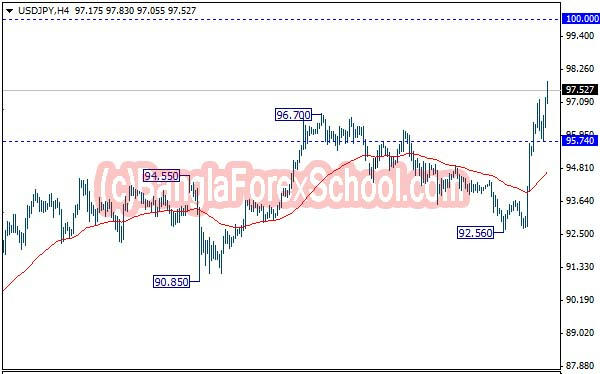
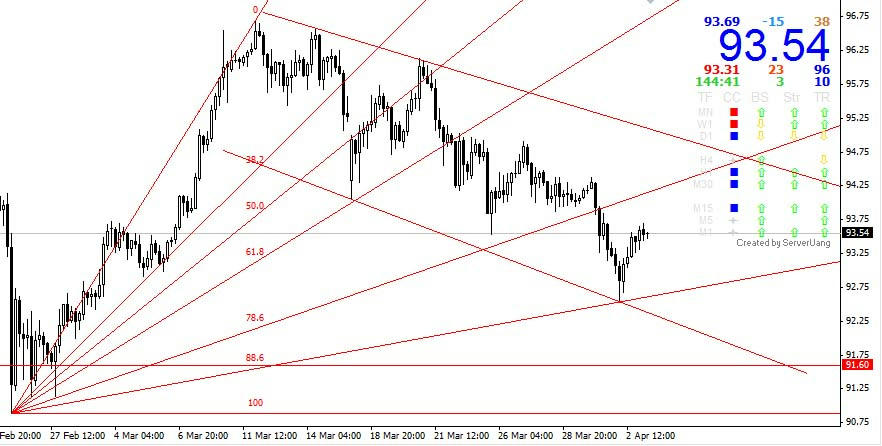
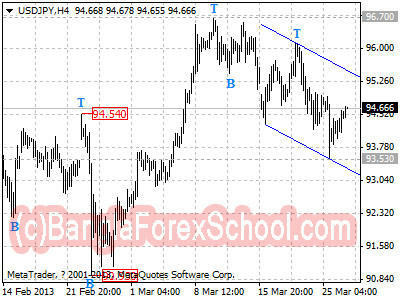 USD/JPY এখনো ডাউন ট্রেন্ড এ রয়েছে যা শুরু হয়েছিল 96.70 থেকে। তবে কালকে প্রাইসের কিছুটা উঠে যাওয়াকে Downtrend Consolidation বলা যেতে পারে। Key Resistance 4H চার্টে Upper Trendline এ আছে। তাই Resistance Hold করা পর্যন্ত মার্কেট নিচে যাবে বলে ধারণা করছি। পরবর্তী টার্গেট হতে পারে 92.00 – 93.00 এরিয়া। অপর দিকে Resistance এর ক্লিয়ার ব্রেক ডাউন ট্রেন্ড কমপ্লিট এর সিগন্যাল দিবে এবং নতুন ট্রেন্ড শুরু করবে।


